00 — Overview
Building a better model isn't the final decision. Deciding when it's ready for real users is.
A team gives it a slice of traffic first — say, 25% — and watches. Then someone has to decide: keep going, hold, or pull it back.
That call depends on four things — is it accurate, is it safe, is it usable, is it stable. I built one place to see all four together.
ProblemA model can improve overall while getting worse for one group.
ApproachCompare the new model to the current one, across four areas that matter.
DecisionMove forward, hold, or roll back — and write down why.
↓
↓
Quality
Safety
Experience
Reliability
↓
What Actually Happened Fictional Data — Product Concept Illustration
Overall, the new model looked healthy. One user group told a different story.
Across Everyone
3.8% → 4.1%
Answers without enough evidence. Barely moved.
Within limit
One Group: Spanish-Language Legal & Financial Questions
5.2% → 8.9%
Same measure. A much bigger jump.
Limit breached
Decision: HOLD AT 25%. The team held there. Before going further, they added the test that had been missing.
An answer "without enough evidence" just means the model made a claim it couldn't really back up.
Walkthrough
Walkthrough video
coming soon
A short walkthrough will show the full flow — from spotting the issue to holding the rollout.
01 — The Problem
One decision depends on five sources of evidence.
Before a team expands a rollout, they have to check a lot of things: model tests, safety signals, experiments, system performance, moderation alerts.
Those all live in different tools.
So I asked a simple question: what if they all lived in one place instead?
Model EvaluationTests that check answer quality and accuracy.
Safety TestingChecks for harmful or unsafe responses.
Staged ExperimentationTools for testing a rollout in stages.
Infrastructure ReliabilityTracks uptime, speed, and errors.
Moderation SignalsAutomatic flags — a signal, not a confirmed violation.
↓
Is there enough evidence to move forward?
↓
One place to make that call.
Key takeaway. The answer isn't more analytics. It's one workspace, built around the decision itself.
How This Took Shape
Question
What actually helps someone decide if a model is ready?
Hypothesis
Maybe it's not more data. Maybe it's fewer, better-organized decisions.
What changed
I stopped asking how to visualize more data and started asking how people actually decide to ship something.
Final reasoning
A good tool doesn't remove the hard part. It just makes the hard part visible.
02 — How It Works
Four people, one decision.
Can we safely give the new model more traffic?
Product Manager
Needs to know
Can we safely increase traffic?
Owns
Convenes the decision and the record
Main risk
Mistaking an overall win for a full win
Model Researcher
Needs to know
Did the model actually improve?
Owns
Recommends advance or hold, on quality grounds
Main risk
Trusting test results over real usage
Safety Reviewer
Needs to know
Did harmful behavior change?
Owns
Can block the rollout alone
Main risk
Mistaking a flagged signal for a confirmed violation
Infrastructure Engineer
Needs to know
Is the issue the model or the system?
Owns
Confirms system reliability is within limits
Main risk
Blaming the model for a system problem
Key takeaway. It's built around decisions. Not metric categories.
03 — Metrics
Four questions, not one score.
Every metric comes with a tradeoff. There's no single score — just four areas, checked on their own, every time.
Quality
Does the model complete tasks correctly?
Task success rate
Unsupported-claim rate
Change vs. current model
Test coverage
Safety
Does it avoid harmful answers without blocking safe requests?
Moderation flags (signal only)
Safe requests incorrectly blocked
Harmful requests incorrectly answered
Serious incidents
Experience
Can users finish their tasks without repeatedly trying again?
Task completion rate
Retry rate
Worst-affected user group
Reliability
Is the product fast and stable?
Response time (slowest 5%)
Errors / timeouts
Uptime & data freshness
Every Improvement Has a Tradeoff
Better answers
⇄
Slower responses
Fewer blocked requests
⇄
More safety risk
Overall improvement
⇄
One group getting worse
More alerts
⇄
More false alarms
Faster release
⇄
Less evidence
What Makes a Metric Trustworthy?
If a number can't answer these questions, it doesn't get shown. Here's a real example from the story above — the Spanish-language legal and financial group. Fictional Data — Product Concept Illustration
Is there a known gap?
Missing test logged
How much data supports it?
4,820 requests
How certain is the result?
High
Where did it come from?
Staged experimentation
Which model was measured?
New model (test version)
Did it cross a limit?
Limit breached
How much did it change?
+3.7 pts
Same regression as before. Logged as a missing test — not just a bad result.
Key takeaway. A number without its context and its tradeoff doesn't ship.
03 — Rollout Story
Why the rollout paused.
Nothing here moves forward just because time passed. It moves when there's enough proof. Fictional Data — Product Concept Illustration
Test the new model with 25% of traffic
Compare four health areas
Find one user group getting worse
Add a new test and try again
Some of these comparisons are simulated — real questions run through the new model, without showing it to everyone yet. Simulations can miss context. So instead of pretending every result is exact, the dashboard shows how much to trust it.
Show detailed workflow
Candidate enters 25% rollout
Required sample size (61,400 requests) + 9-day soak period reached (min. 7 days / 50,000 requests)
Four domains evaluated
Model ResearcherSafety ReviewerInfra Engineer
Aggregate improvement detected
Worst-segment regression surfaced
Alert reviewed
Safety ReviewerModel Researcher
Evidence compared with incumbent
Team records decision
Product Manager convenes
New evaluation / mitigation assigned
Alert Lifecycle
04 — Product Screens
Five screens. One rollout decision.
The experience follows one model rollout from the first warning to the final recorded decision. Each screen answers the next question the team needs to resolve. Fictional Data — Product Concept Illustration
01 — Detect
01
Rollout Overview
"What stopped the rollout?"
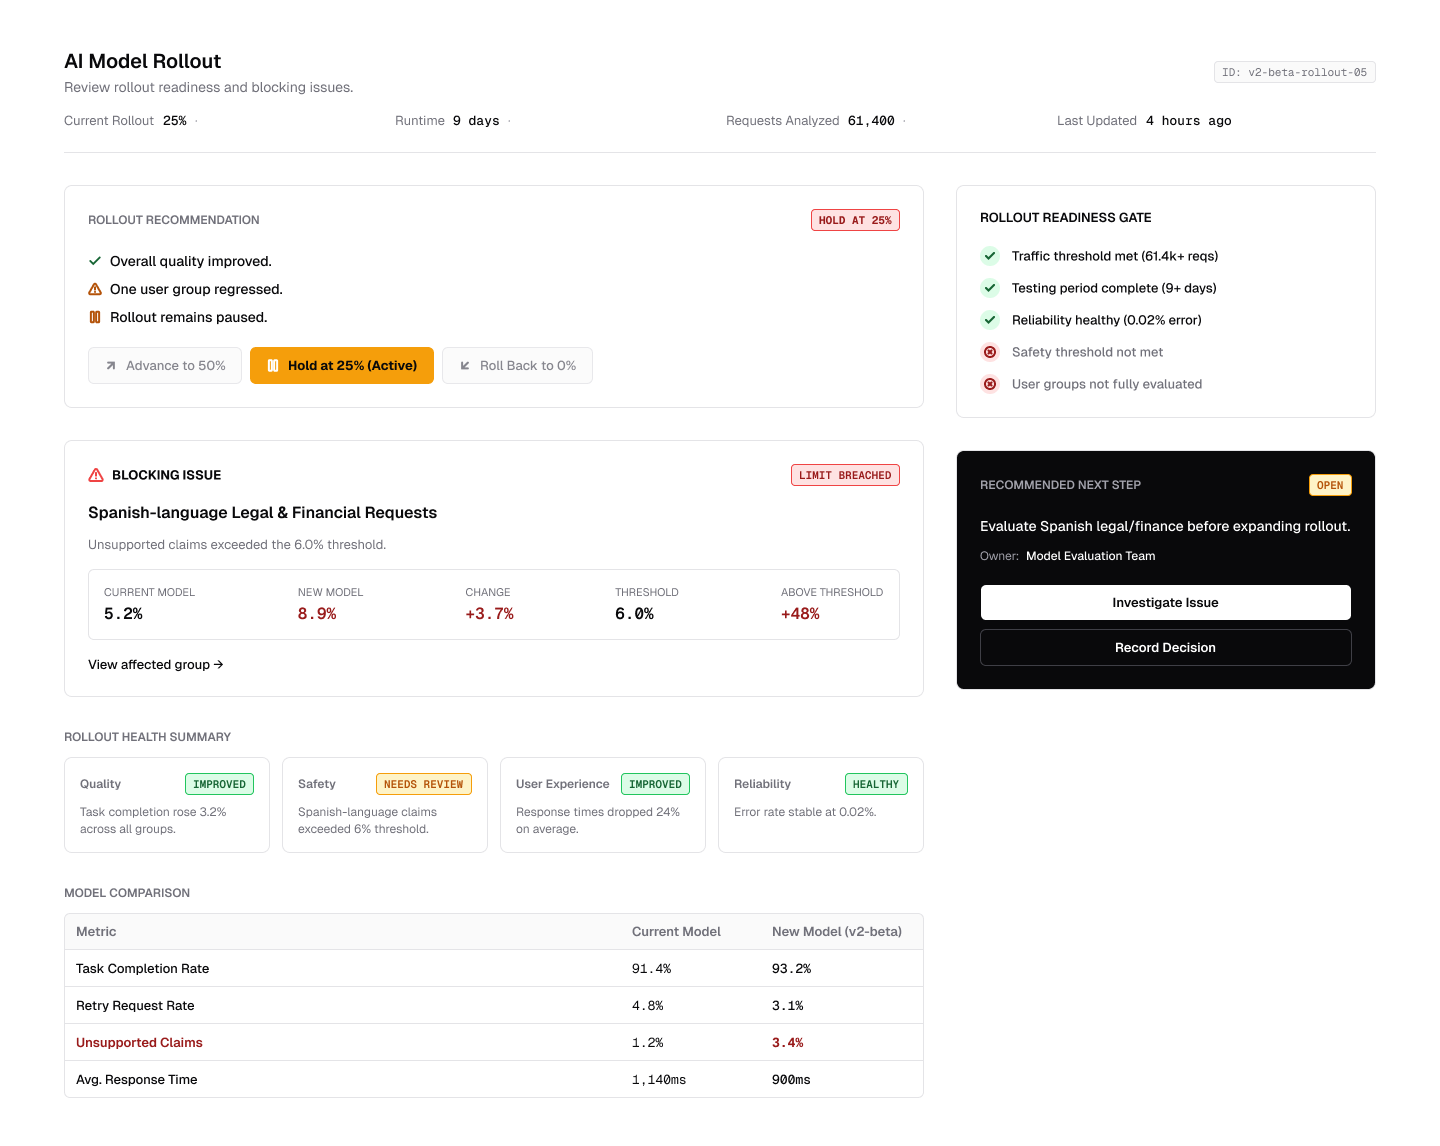
The overview brings the current rollout stage, readiness requirements, health areas, and blocking issue into one place. Most signals look healthy, but one user group has crossed a quality limit.
Why it matters. The screen prevents an overall improvement from hiding a meaningful group-level regression.
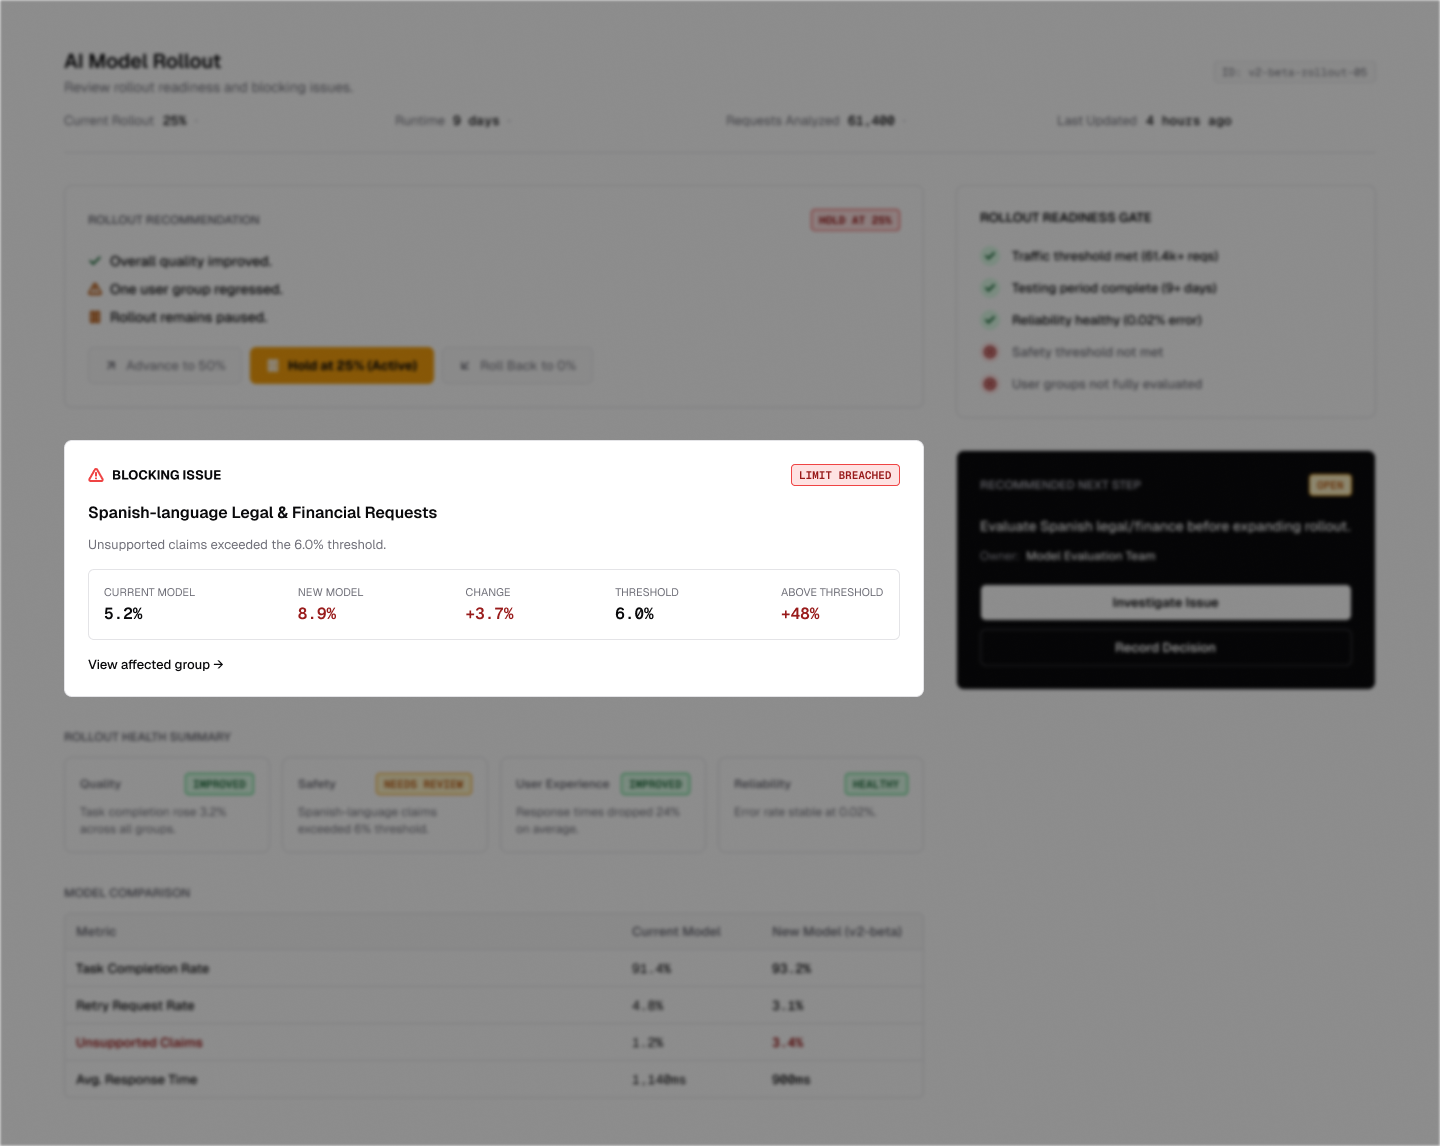
The rollout appeared ready to expand until the dashboard surfaced one group whose unsupported claims rose from 5.2% to 8.9%.
What this shows. I designed the overview around the reason the rollout cannot advance — not around a generic collection of KPIs.
A Quick Recap Before Comparing
TradeoffsEvery gain has a cost somewhere else. Better answers, slower responses. Overall improvement, one group getting worse.
Evidence CheckA number only counts if it shows how recent it is, how much data backs it, and whether it crossed a limit.
The FlowSpot a signal → compare the models → find who's affected → decide → record it.
02 — Compare
02
Compare Health Areas
"Which part of product health is blocking the rollout?"
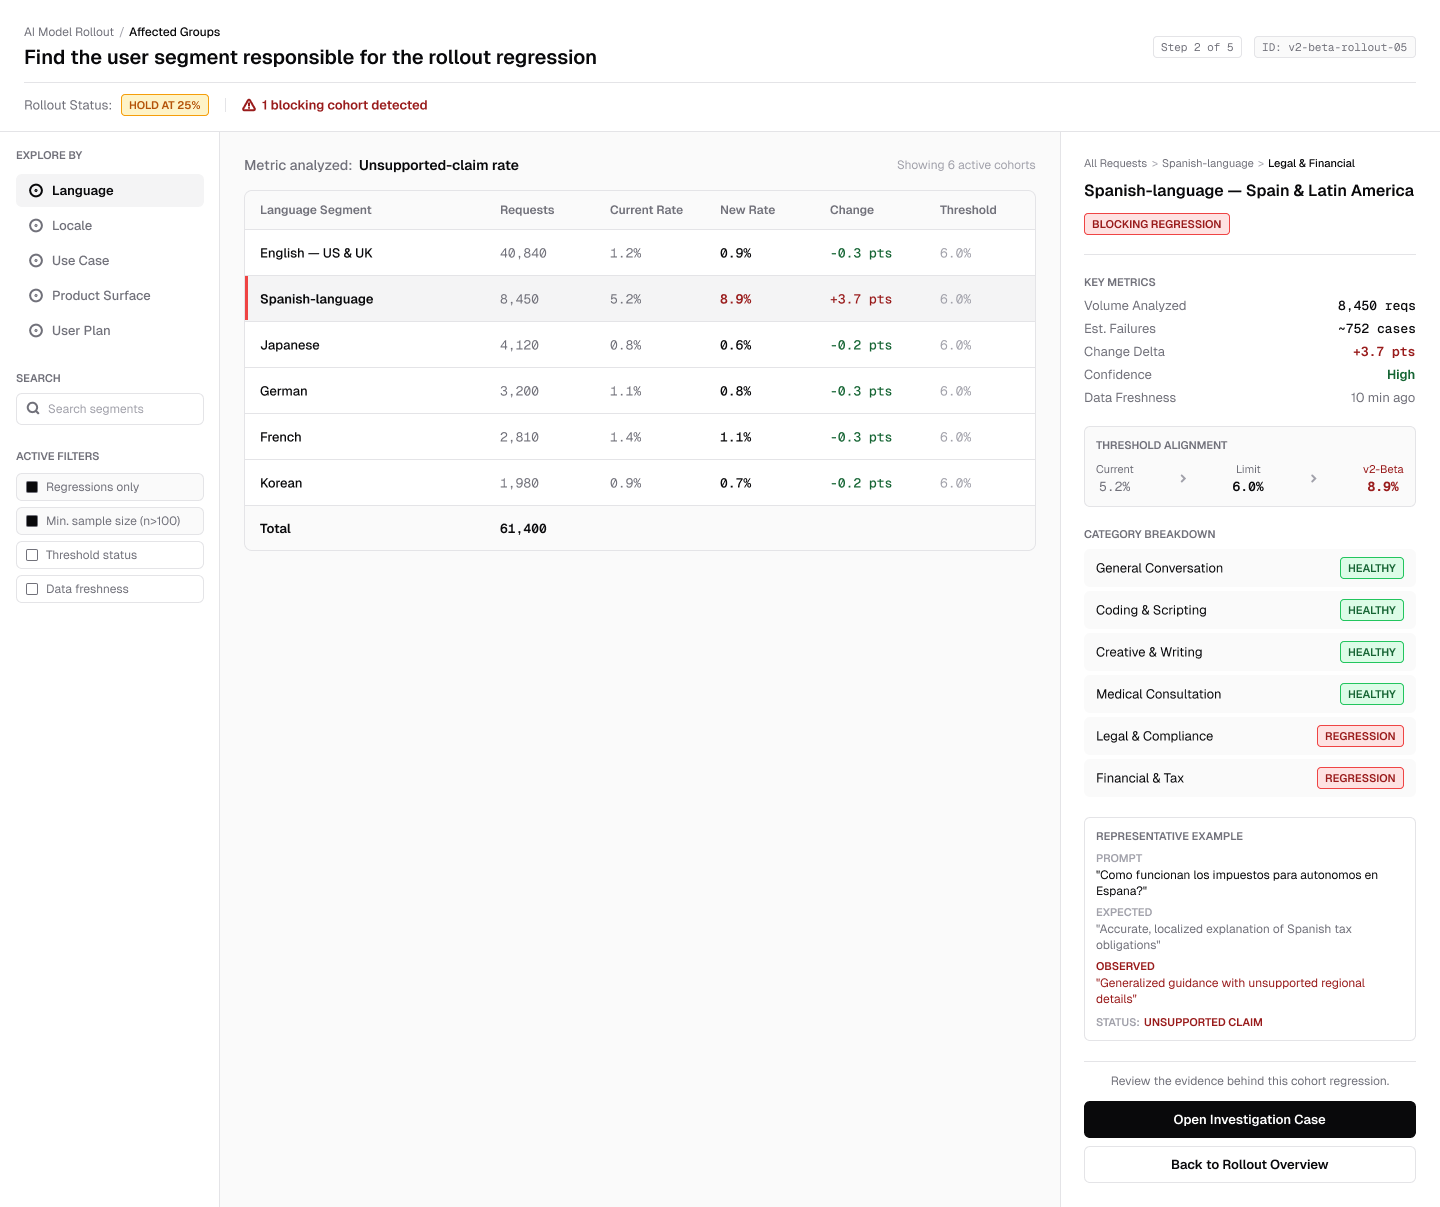
This screen compares the new model with the current model across quality, safety, user experience, and reliability. Each area stays separate so one strong result can't cancel out a meaningful regression elsewhere.
Why it matters. A rollout shouldn't get one overall health score. The team needs to see where performance improved, where it stayed stable, and where it failed.
What this shows. I treated product health as a set of connected tradeoffs rather than one simplified score.
03 — Investigate
03
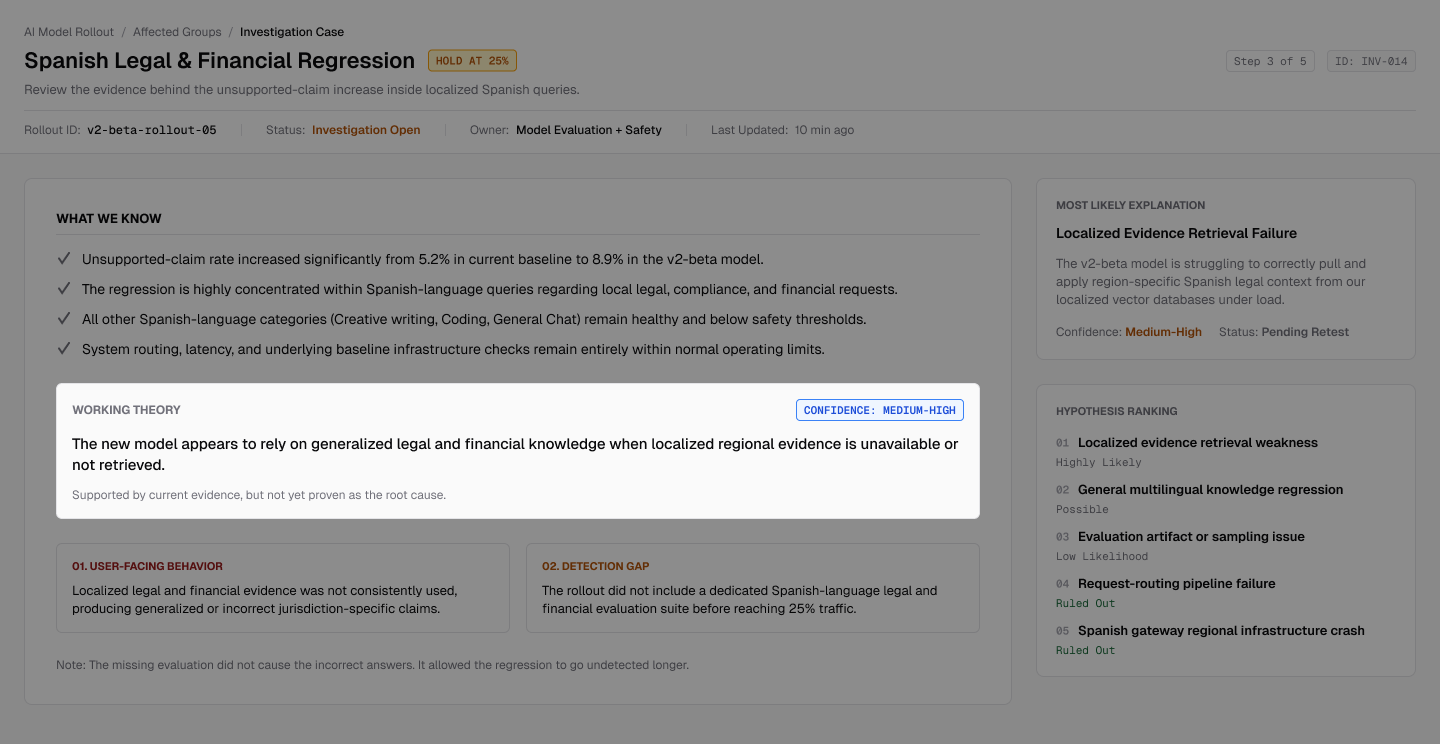
Investigation Case
"What do we know, and what still needs to be proven?"
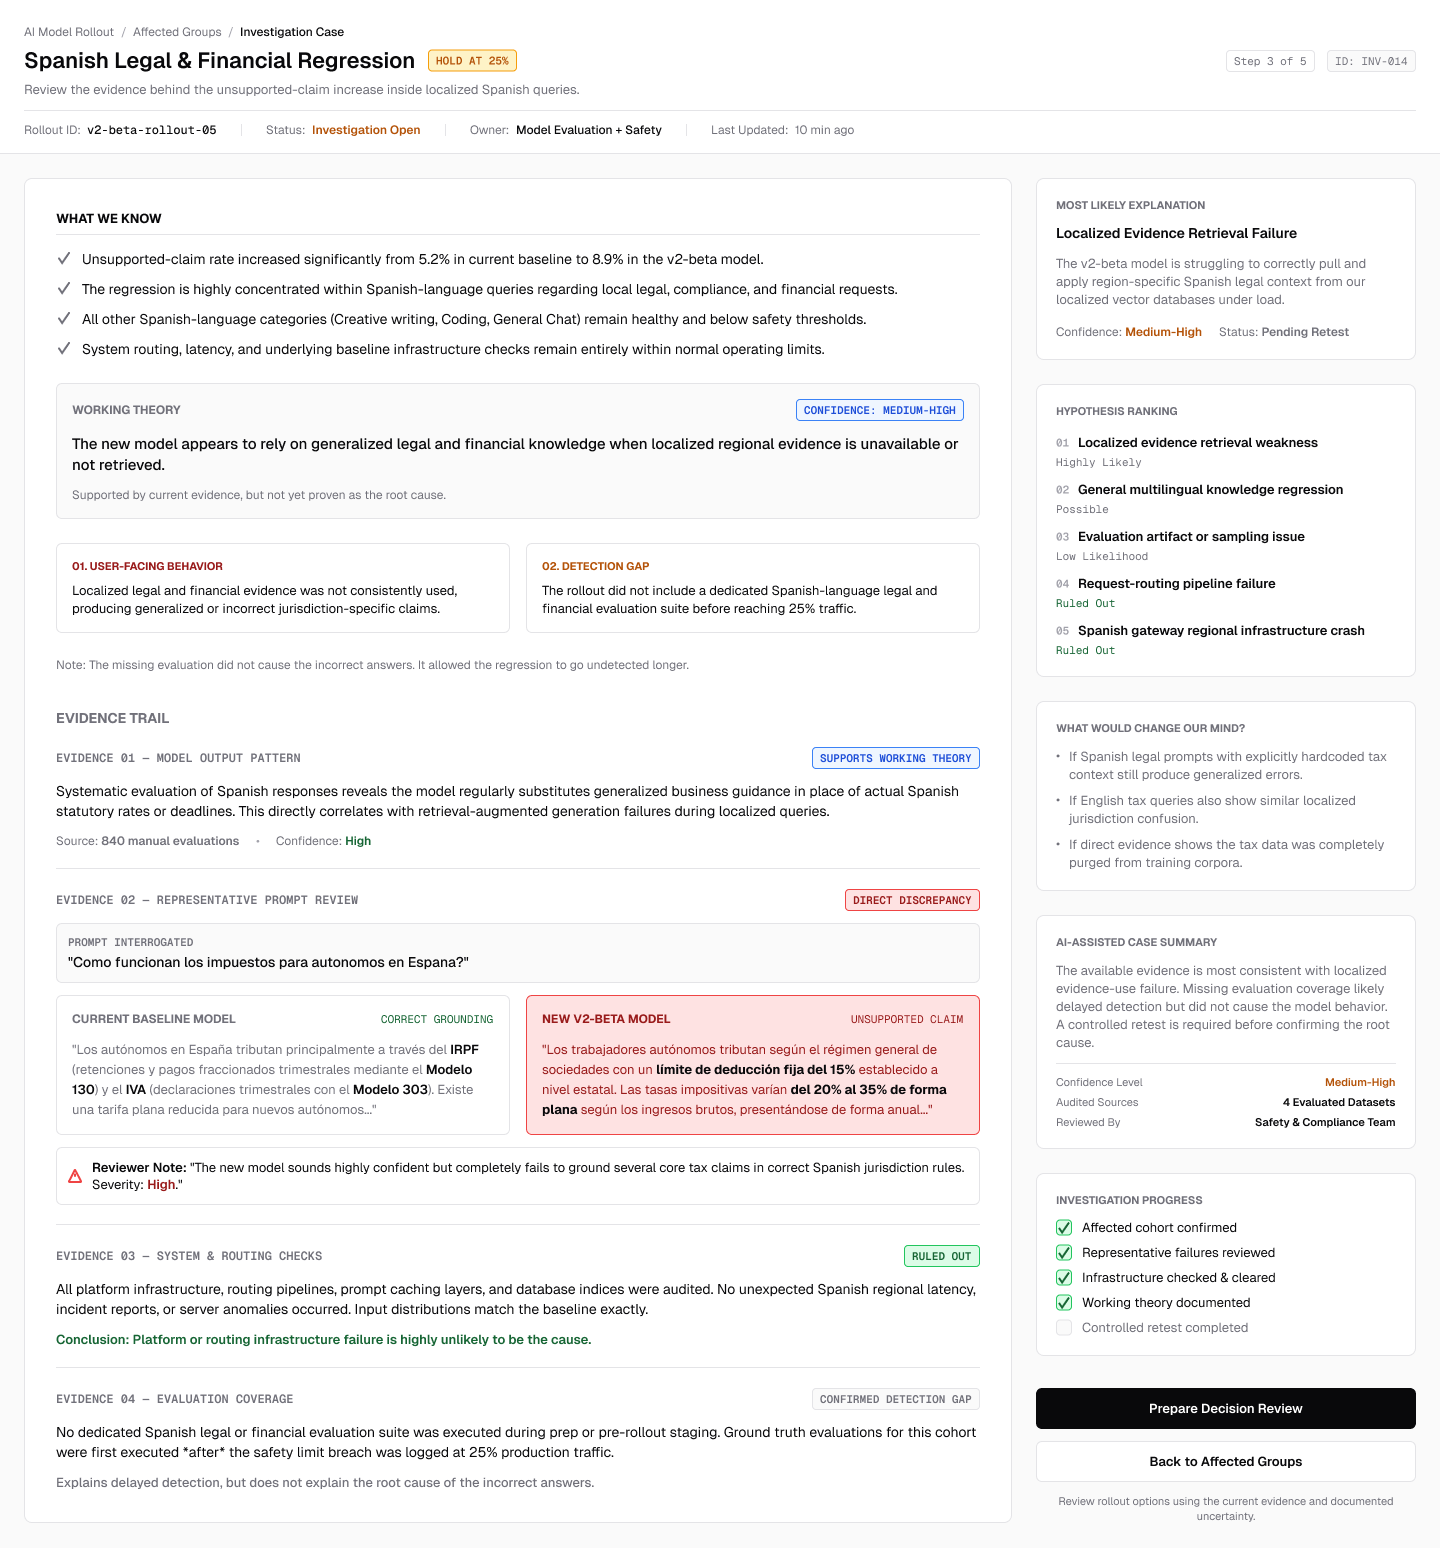
The investigation separates confirmed observations from a working explanation. It records what changed, what the team currently believes, which alternatives have been ruled out, and what evidence is still missing.
Why it matters. The interface helps the team reason under uncertainty without presenting a coincidence as proven causation.
The team has a likely explanation, but the dashboard keeps the uncertainty visible. A missing test may explain why the problem went undetected — without proving what caused it.
What this shows. I designed AI and analytical support to expose uncertainty — not conceal it behind a confident answer.
04 — Prepare
04
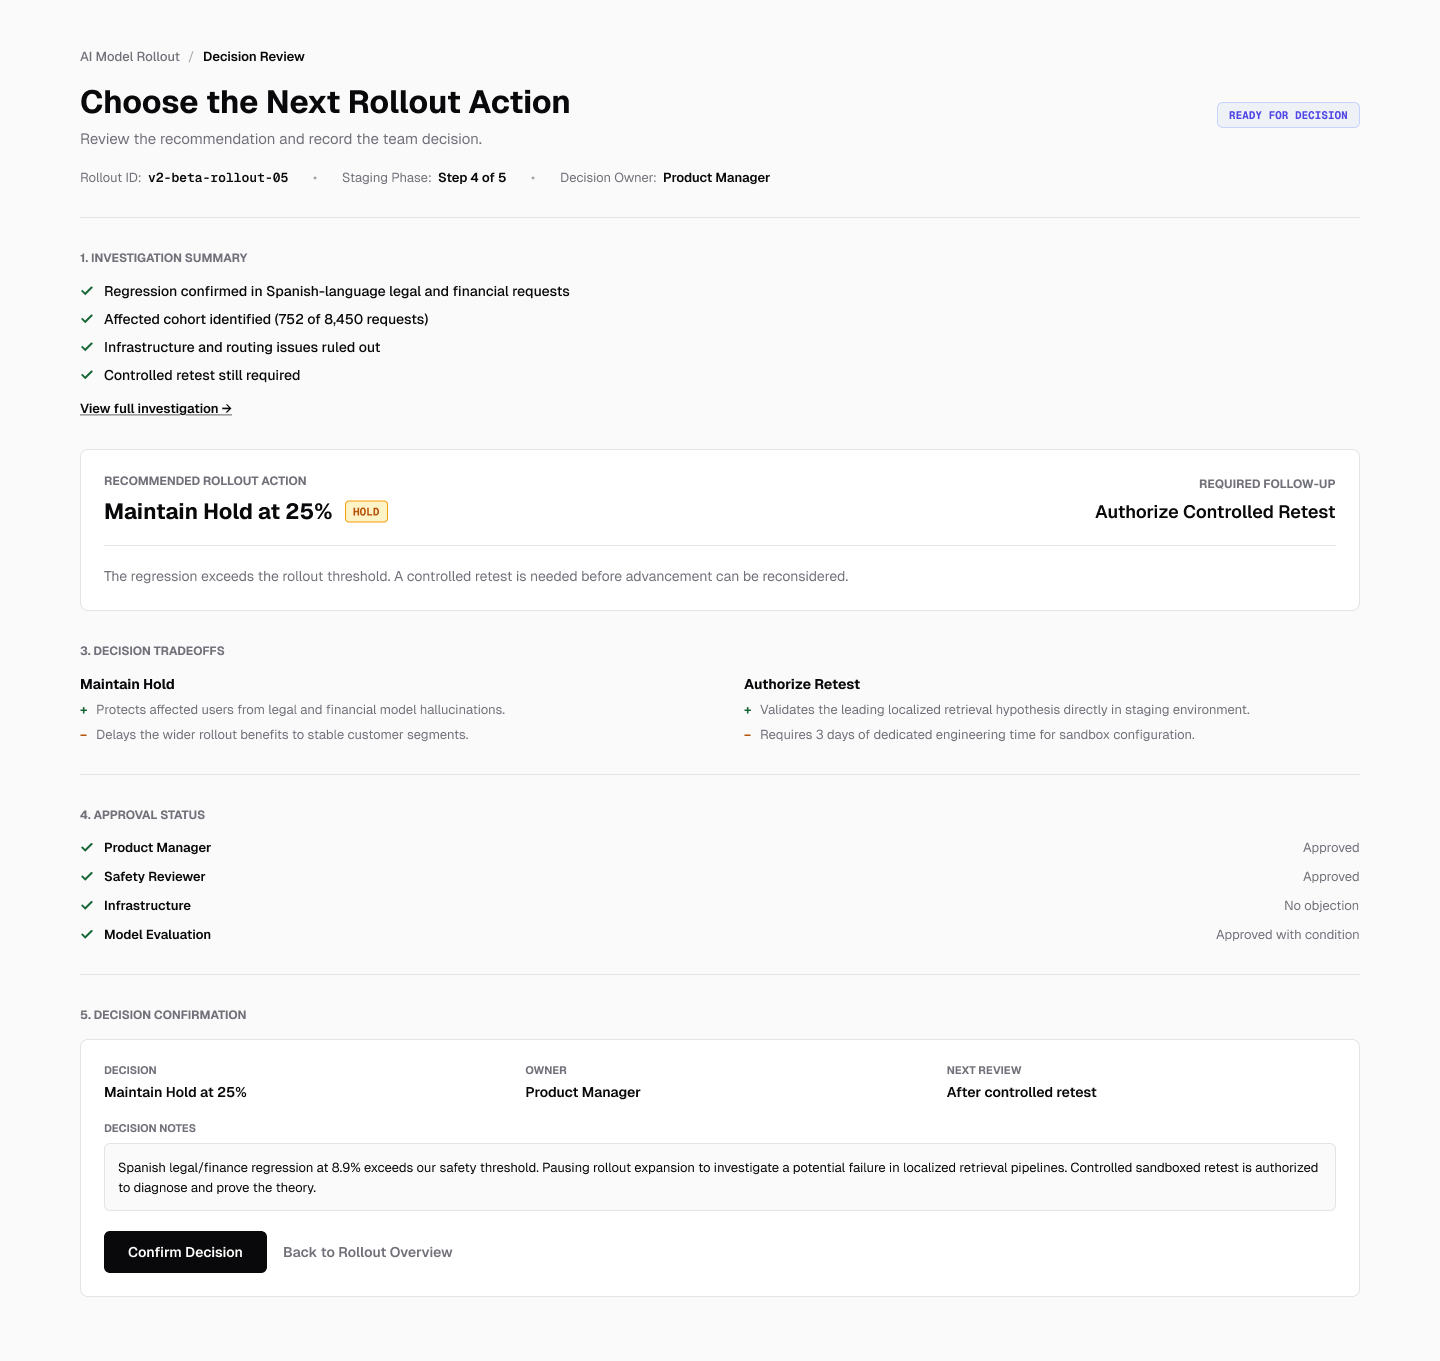
Investigate the Alert
"What changed?"
This is where the team gathers what's been learned so far — the evidence collected, the explanations considered, and what's still unresolved. Before anyone recommends advancing or holding, the review has to be based on what's actually known, not the first plausible story.
Why it matters. A final decision should be based on reviewed evidence, not on the loudest alert or the first plausible explanation.
What this shows. I designed a clear handoff from investigation to accountable decision-making.
05 — Decide
05
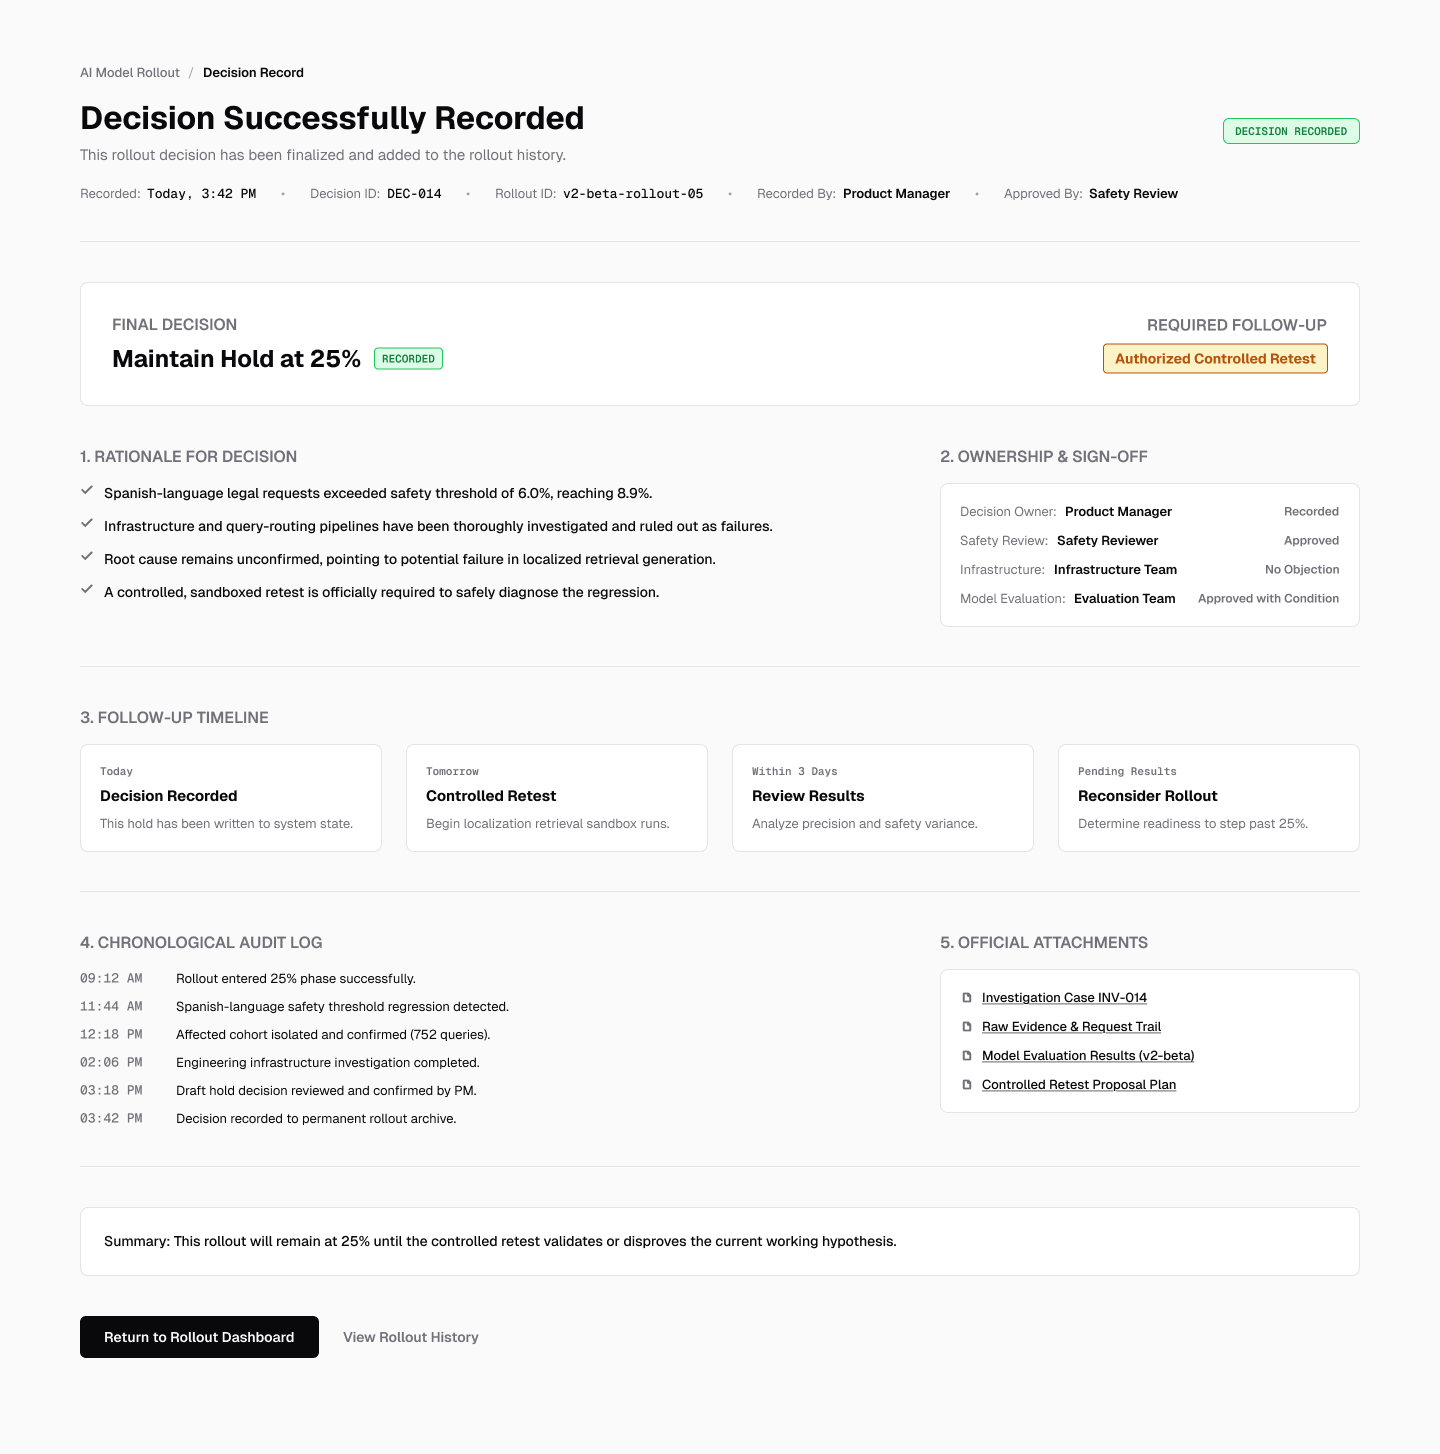
Decision Record
"What did the team decide, and what happens next?"
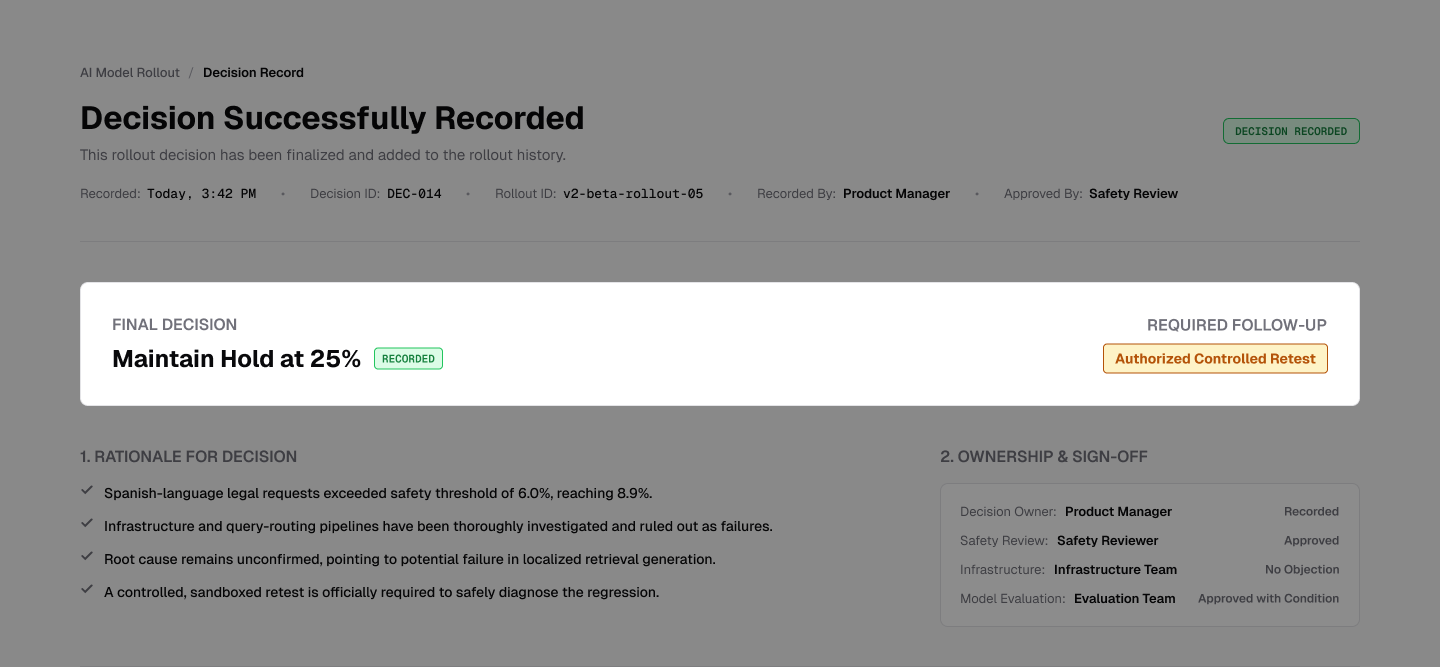
The final screen records the selected action, rationale, owners, approvals, unresolved uncertainty, and required follow-up. In this scenario, the team maintains the rollout at 25% and authorizes a controlled retest.
Why it matters. Finding a regression isn't the end of the product workflow. The evidence has to become an accountable decision with a clear next step.
The team holds the rollout at 25% and requires a controlled retest before reconsidering expansion.
What this shows. I designed the decision as a permanent, human-owned product artifact — not an AI-generated recommendation that disappears after the review.
06 — AI Judgment
AI organizes evidence. It doesn't own the decision.
AI Can
Summarize changes
Group related alerts
Find similar past issues
Draft explanations with sources
People Must
Confirm what caused the issue
Decide to advance, hold, or roll back
Approve actions
Review sensitive evidence
AI Example Fictional Data — Product Concept Illustration
AI-Assisted — What ChangedAnalysis model v2.3
Right when the new model hit 25% of traffic, one group started getting more answers without enough evidence.
Sources
3 linked evaluations, 1 experimentation log
Confidence
Related, but not proven to be the cause
Alternative explanation
No test covers this group yet — this could be an existing gap, not something the new model caused
Missing evidence
No prior baseline test for this group
Analysis model / version
Internal analysis model v2.3
"Possible contributing factor detected — related, but not proven to be the cause."
Key takeaway. AI points to evidence. A person owns the decision.
05 — Measure & Learn
How I'd know if this is working.
Time to understand the problem
Why it matters
How fast the team gets a clear explanation
Problems caught before wider release
Why it matters
The main reason this system exists
False alarms
Why it matters
Keeps trust in the alert system
Complete rollout reviews
Why it matters
% of rollouts where all four areas were checked
Decisions made with current data
Why it matters
Guards against acting on outdated evidence
Incidents turned into new tests
Why it matters
Whether the team learns from problems
Accuracy of the final explanation
Why it matters
Whether the fast answer was also the right one
North Star: Catch meaningful problems before the model reaches more users.
Nothing here has been measured yet. This is the plan for finding out — have a few PMs, researchers, and safety reviewers work through this same story and see if they land on the same call.
Key takeaway. No outcomes claimed. Just the method for finding out.
08 — Roadmap
What ships first.
MVP
One rollout, four health areas, one decision record.
Phase 2
More products, deeper group analysis, and incident workflows.
Phase 3
AI summaries, cross-product insight, and cost/capacity context.
Not in the MVP
No company-wide BI
No finance dashboard
No autonomous rollout decisions
No overall health score
It only grows once this one workflow proves it actually helps.
Key takeaway. Depth on one rollout workflow, before breadth across the company.
09 — Reflection
I started designing a dashboard. I ended up designing a decision.
More data wasn't the answer. The harder problem was helping a team see the tradeoffs without hiding the uncertainty — no single score, no metric without its context, no AI explanation without its evidence.
The best version of this isn't the one that makes model health look simple. It's the one that helps a team understand why they should wait.
"Good internal tools do not remove uncertainty. They make it easier to act responsibly in spite of it."
Sources & Disclosure
Read the full disclosure
Not an official OpenAI project
Does not imply employment by OpenAI
Does not use internal OpenAI data
No claimed knowledge of OpenAI's private rollout systems
Not validated by OpenAI employees
No claimed measured business impact
All scenario data is fictional and illustrative
Research date-locked: July 22, 2026
View research sources
Primary/official sources are prioritized; where multiple accounts covered the same event, only the strongest independent account is kept. One arXiv preprint is retained and explicitly labeled as unreviewed.
[13]Reputable journalism. TechCrunch — OpenAI acquires product testing startup Statsig... (Sept 2, 2025). techcrunch.com/...
[15]Official. Datadog — Datadog LLM Observability Is Now Generally Available... (press release). datadoghq.com/...
[16]Official. PagerDuty — The Incident Response Lifecycle for DevOps Teams. pagerduty.com/...
[18]Unreviewed preprint (not peer-reviewed). Coggins, S. et al. — The 2025 OpenAI Preparedness Framework does not guarantee any AI risk mitigation practices, arXiv:2509.24394. Cited only to support the design principle that a single discretionary score can obscure real risk. arxiv.org/abs/2509.24394